
Authors: Servaas Houben
link: http://theeuropeanactuary.org/downloads/TEA%2017-juni2018-web.pdf (pages 5-9)
pdf: TEA 17-juni2018-web
Publisher, publication date: The European Actuary, 2018-06
——————————————————————————————————————————
Background and Scope
Despite limited Caribbean data, the Worldbank dataset shows a remarkable overall trend of increasing life expectancy for the Caribbean region. We agree with Deming’s quote that “without data you’re just another person with an opinion” and therefore believe that despite the challenges of limited data, it is far more preferable to draw conclusions from the available data, than to either use gut feeling, or follow the pricing behaviour of competitors. However, the techniques used for mortality modelling will differ in locations with limited data, and we will show which techniques are available for mortality modelling for smaller populations.
Data availability and checks
The following checks have been applied:
- Insurance group level: Comparison of number of policyholders and number of deaths between mortality study 2015 and 2017 to ensure data consistency;
- Policyholder level: taking a multi-period timeframe and checking for consistency at the policyholder level therefore avoids omitting mortality cases due to system limitations.
Data fitting techniques
Several methods were applied to get a better feel for the overall mortality behavior:
- Least squares method
Comparing the difference between expected (mortality table estimation) with actual (insurance company data). Two fitting techniques are:
- qx: this method is preferred as one can create a best fit for each age independently of another age (e.g. fitting the q80 is independent of q81). However, there were instances for ages 80+ for which no mortality occurred therefore focusing least squares on best fitting 80+ policyholders. We could have applied smoothing where the qx value is a function of qx-1 and qx+1 but felt that by using excess smoothing the overall pattern of the mortality behavior would not represent the original data anymore.
- ex: a drawback of life expectancy fitting is that life expectancy for age x+1 is a function of life expectancy of age x, and hence there is no independence. However this method had the practical advantage that even when there are actual mortality rates of 0 for certain ages, this does not skew the results and hence fitting is done on the part of the data which is most populous. An additional benefit is that due to an increase in life expectancy, pricing of annuities is important which focus on life expectancy.
- Shape of mortality behavior
The final method looked at similarity in the pattern of the mortality table and the actual
insurance data.
Benchmarking
Data limitations increase the importance of benchmarking results:
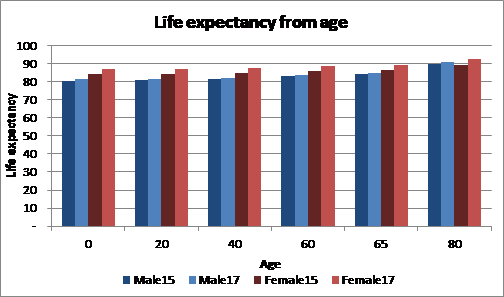
- Previous internal mortality study
As the worldwide trend of an increase in life expectancy is also occurring in Curacao, we would expect to see an increase in life expectancy in the 2017 study compared to the 2015 study. This is indeed the case:
- An industry wide mortality study
This 2015 study was performed by Phenox in Aruba and ex-NA. Our results are in line with the Phenox results which gives us additional comfort that the data aggregation and data analysis have been done correctly:

- Expected vs actual mortalities
This check enables the best fit to be backtested with actual data and hence confirms if the fit is appropriate. As the actual data shows a more bumpy pattern compared to the expected mortality predicted by the mortality table, one can observe an overall fit, however for individual ages differences exist:

Limitations
No analysis has yet been done based on marital status of policyholders, income levels, or the industry people work in. This might be a topic for further research and could provide additional opportunities for pricing segmentation.
Selling it to the business
The following activities help to convince internal and external stakeholders:
Presentations and conferences
Showing local and worldwide trends and the impact of what-if scenarios on profitability will increase awareness of the importance of correct mortality assumptions.
Articles
When clients are aware of the effect of increased life expectancy on pricing, sales projects will run smoother as there is already awareness that the pricing of products could change in the future.
The main point of creating awareness with other stakeholders is to stress the importance of appropriate risk-sharing between the insurance company and policyholder: even with price changes, the insurance company is still insuring mortality and longevity risk which is one of the prime risks of policyholders which is difficult for them to mitigate by themselves.
Conclusion
We believe that the actuarial profession is already well placed to perform the data cleansing and analysis part of mortality modelling, but believe there are opportunities for the profession to create more awareness to other non-actuarial stakeholders than is currently done.
